|
|
Cargo+
The Challenge
2022 is a challenging year for the U.S. freight transportation industry
Since January 2020, the Covid-19 pandemic has had a significant impact on air and maritime freight transportation service in the United States. Supply chain fragility, China's port blockades, the ongoing COVID-19 pandemic, and fragile infrastructure all pose potential challenges to the U.S. transportation industry.
Research
02
Client
University of Washington
Year
2022
Duration
10 Weeks
Form
Database, Website
Tools
Figma, Vertabelo, Visme, PostgreSQL, SQL, HTML, CSS, PHP
My Role(s)
Project Manager
As one of 2 lead database developers, I teach and mentor college students in entity-relationship modeling, the process of visually representing entities, attributes, and relationships to produce ERDs. In addition, I also teach database design strategies such as ERD design in Vertabelo, prototyping in Figma, and creating database in PostgreSQL.
Lead Database Developer
I manage the direction and progress of the project. I write project memorandums, recruit team members, establish a team communication server, outline and direct workload for team members, and report progress to the instructor.
Executive Summary
Goal
Design a database to allow users to query how the Covid-19 epidemic and inflation affect the US air and maritime freight transportation industries.
Solutions
We developed Cargo+, an industry and public health information database that provides transportation industry employees and owners with information on the impact of the Covid-19 epidemic and inflation on the profitability and employment of the U.S. freight transportation industry.
Collecting Federal Government and Private Company Statistics
We focus on collecting federal government resources, online resources, news articles, and interviews about U.S. maritime and air freight transportations during the pandemic. These sources are peer-reviewed by governments and trading companies, who also provide data on price fluctuations for individual imports. These data can help us understand the main drivers that affect freight transportation and merchandise imports during the epidemic. In the database we are about to build, we plan to enumerate various data, such as Covid-19 confirmed cases, maritime container import amount, blank sailing amount, personal consumption expenditure (PCE), air cargo tonne-kilometers (CTK), shipping price index, and transportation cost.
|
U.S. Air and Maritime Freight Revenue & Cargo Volume
Insight: U.S. air cargo volumes have fallen sharply since the start of 2020 but a surge in pandemic-related demand for specific goods such as masks and other personal protective equipment has led to an increase in air freight for imports. Although the early stages of the epidemic caused a sharp decline in U.S. maritime freight volume, the increase in U.S. economic activity and sharp rise in consumer demand in mid-2020 led to a recovery in merchandise trade and a shortage of maritime freight capacity in the shipping industry. During this period, U.S. container shipping companies worked hard to restore capacity to previous levels.
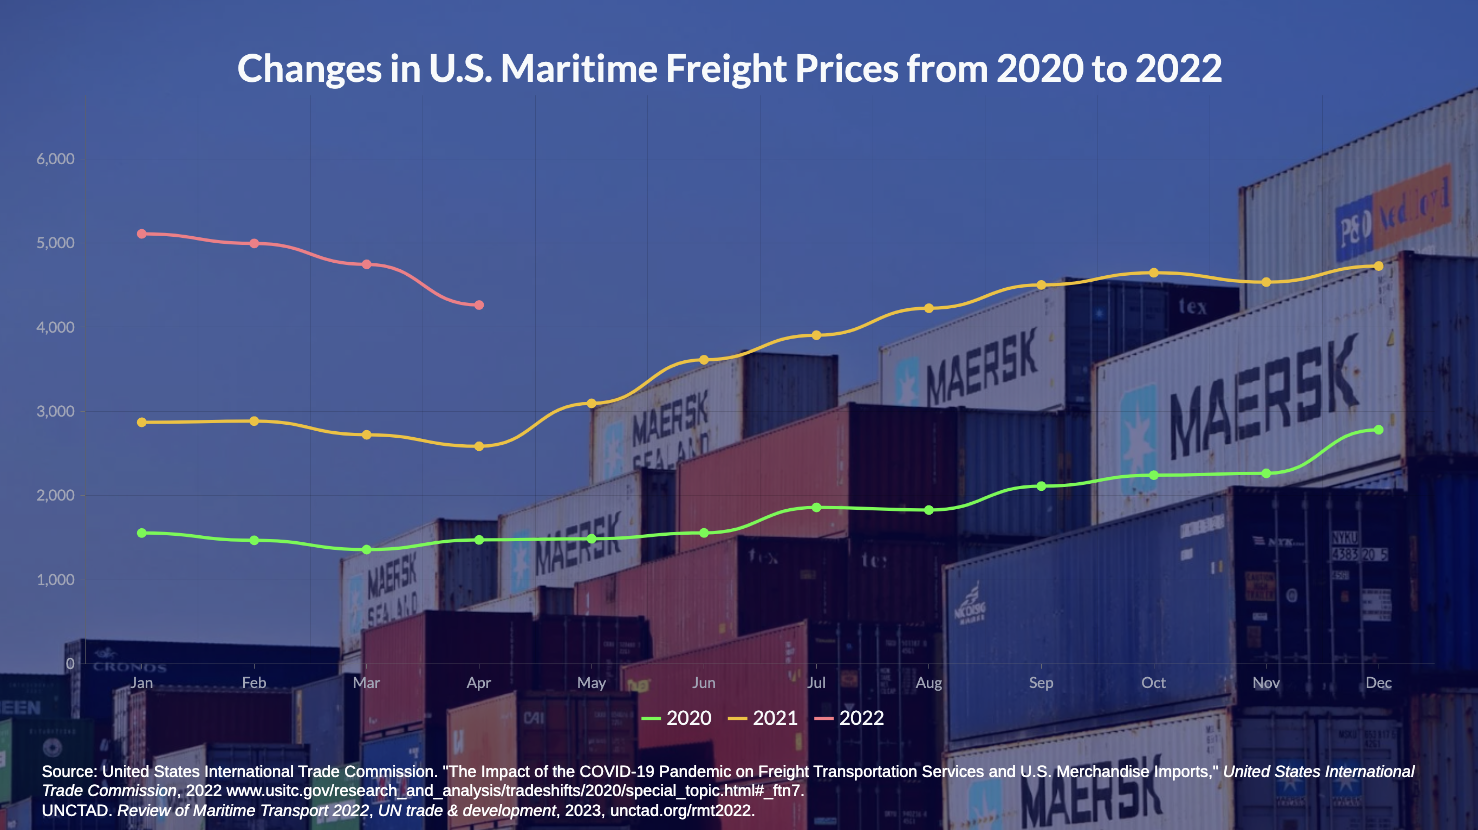
U.S. Air and Maritime Freight Price Changes
Insight: The international community has severely restricted passenger air travel to prevent the spread of the Covid-19 epidemic. With passenger fare revenue declining, airlines have had to turn to cargo to support their basic operations, which has prompted an increase in air cargo prices. The contraction of U.S. merchandise trade and the slowdown of China's manufacturing industry in the early stages of the epidemic led container companies to cancel scheduled flights in order to reduce costs. Maritime freight rates rose sharply in the second half of 2020 as trade recovered and exceeded shipping capacity in mid-2020.
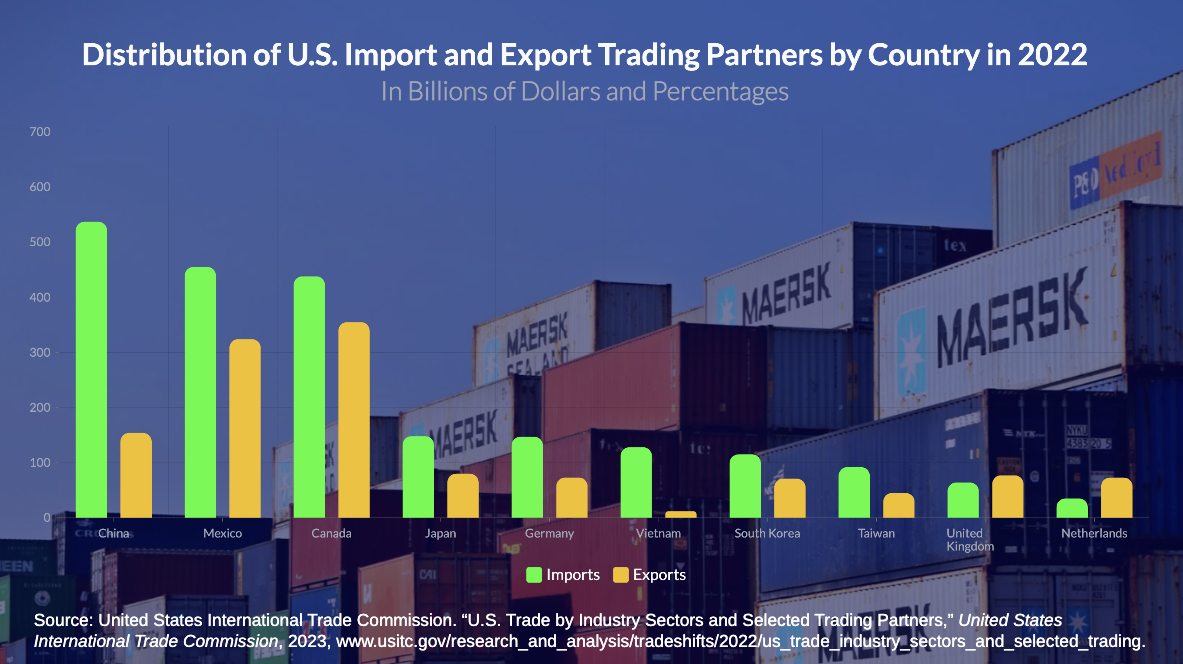
Distribution of International Air and Maritime Freight Routes
Insight: As the largest trading partner of the United States, the blockade policy adopted by China during the epidemic not only became the main reason for the slowdown in China's manufacturing industry, but also exposed the fragility of the global trade supply chain. Massive transportation disruptions have severely impacted businesses and their ability to supply the U.S. market.
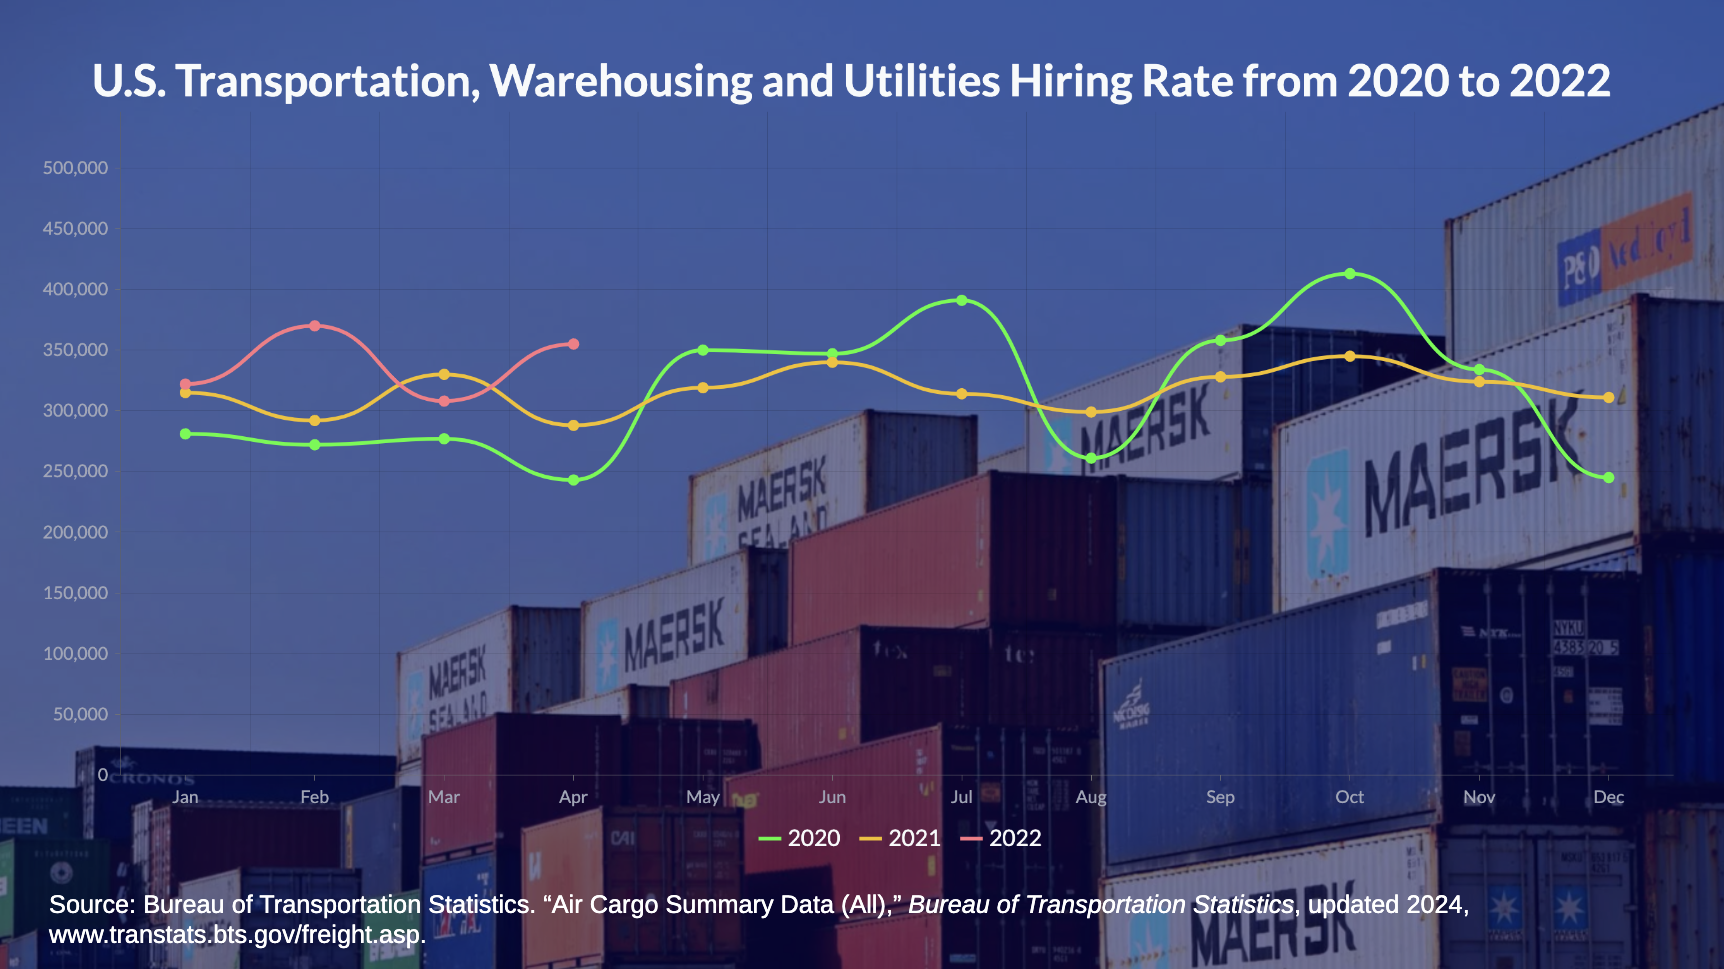
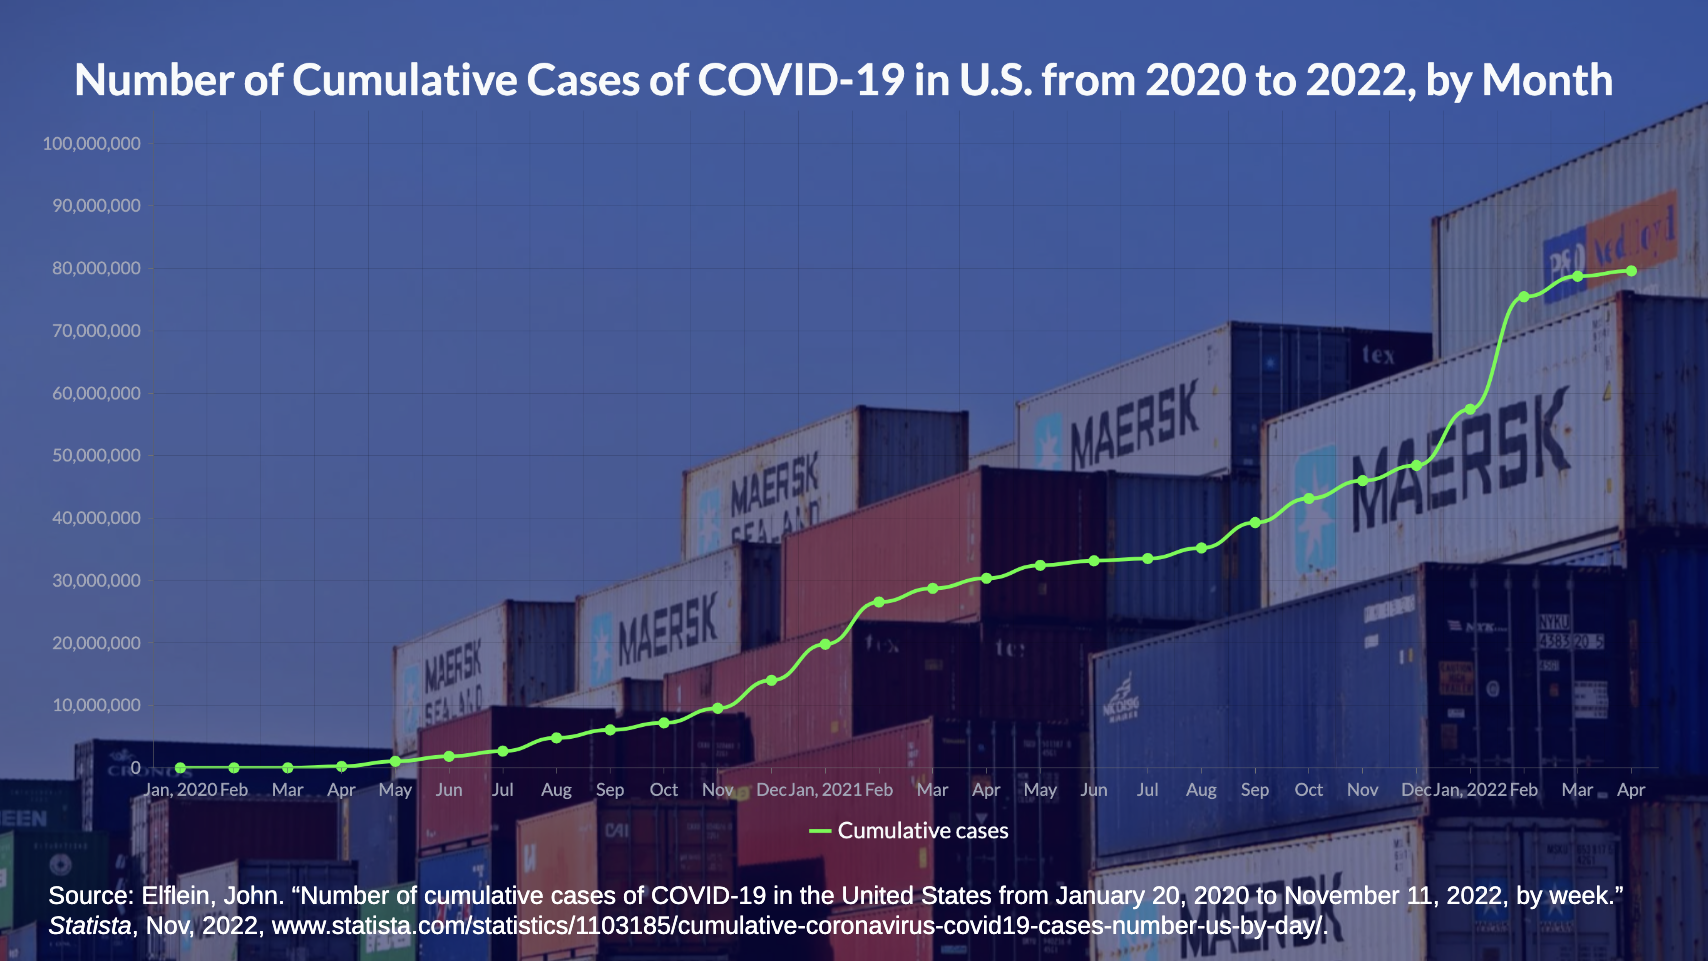
U.S. Freight Industry Hiring Rate Compared with COVID-19 Confirmed Cases
Since the largest trading partners of the U.S. maritime freight industry are located in East Asia such as China, the outbreak of Covid-19 in China has directly caused long-term damage and impact to the U.S. trade supply chain.
Restrictions on passenger flights have led air carriers to focus on cargo and change inventory management decisions.
Part of the main reason for the increase in freight transportation costs is that insurance costs, especially in Northeast Asia, have risen during the Covid-19 epidemic.
Design
Insight: Covid-19 has wreaked havoc on the U.S. labor market, but the U.S. freight transportation industry is in a unique situation. In mid-2020, American society had a large demand for personal protective equipment, which led the U.S. freight industry to expand its recruitment of employees to quickly restore the reduced transportation capacity. However, Covid-19 infection rates continue to threaten the health and safety of dockworkers and caused maritime personnel costs to rise by 6.2% in 2020.
Research Insights
Unexpected Research Findings
In the freight industry, low-wage jobs are more likely to suffer from job shortages when encountering major public health crises such as the Covid-19 epidemic. Compensatory wages, relocation, travel allowance, and quarantine allowance are all reasonable compensation measures.
The increase in demand for air and maritime freight transportation service is not because the Covid-19 epidemic is easing, but because consumers are shifting their spending from services to equipping their home offices with personal protective equipment.
Since there is a greater economic incentive to export empty containers to Asia than to ship U.S. goods in containers to Asian markets, the container shortage has increased container leasing rates and acted as a barrier to U.S. exports.
Ideation
Preliminary Concept
In response to the Covid-19 epidemic, I organized offline and online group discussions outside the classroom and formulated weekly discussion topics and goals to determine the preliminary concept of our database design.
Data-driven design
The back-end data should support the front-end interface in order to let users have a barrier-free user experience.
Standardized Data Structure
The intuitive data structure helps users easily distinguish the relationships of the data, and it is more easier to define, maintain, and operate the database.
Optimize Data Quality
Consistent formats, terminology, and classifications allow users to clearly understand and search data.
Automated Tasks
The database should save users' search records and query details to provide users with more accurate and reliable information and reduce potential errors.
Personalized Content
Adjust the content and data displayed to users based on their search patterns, preferences, and interests.
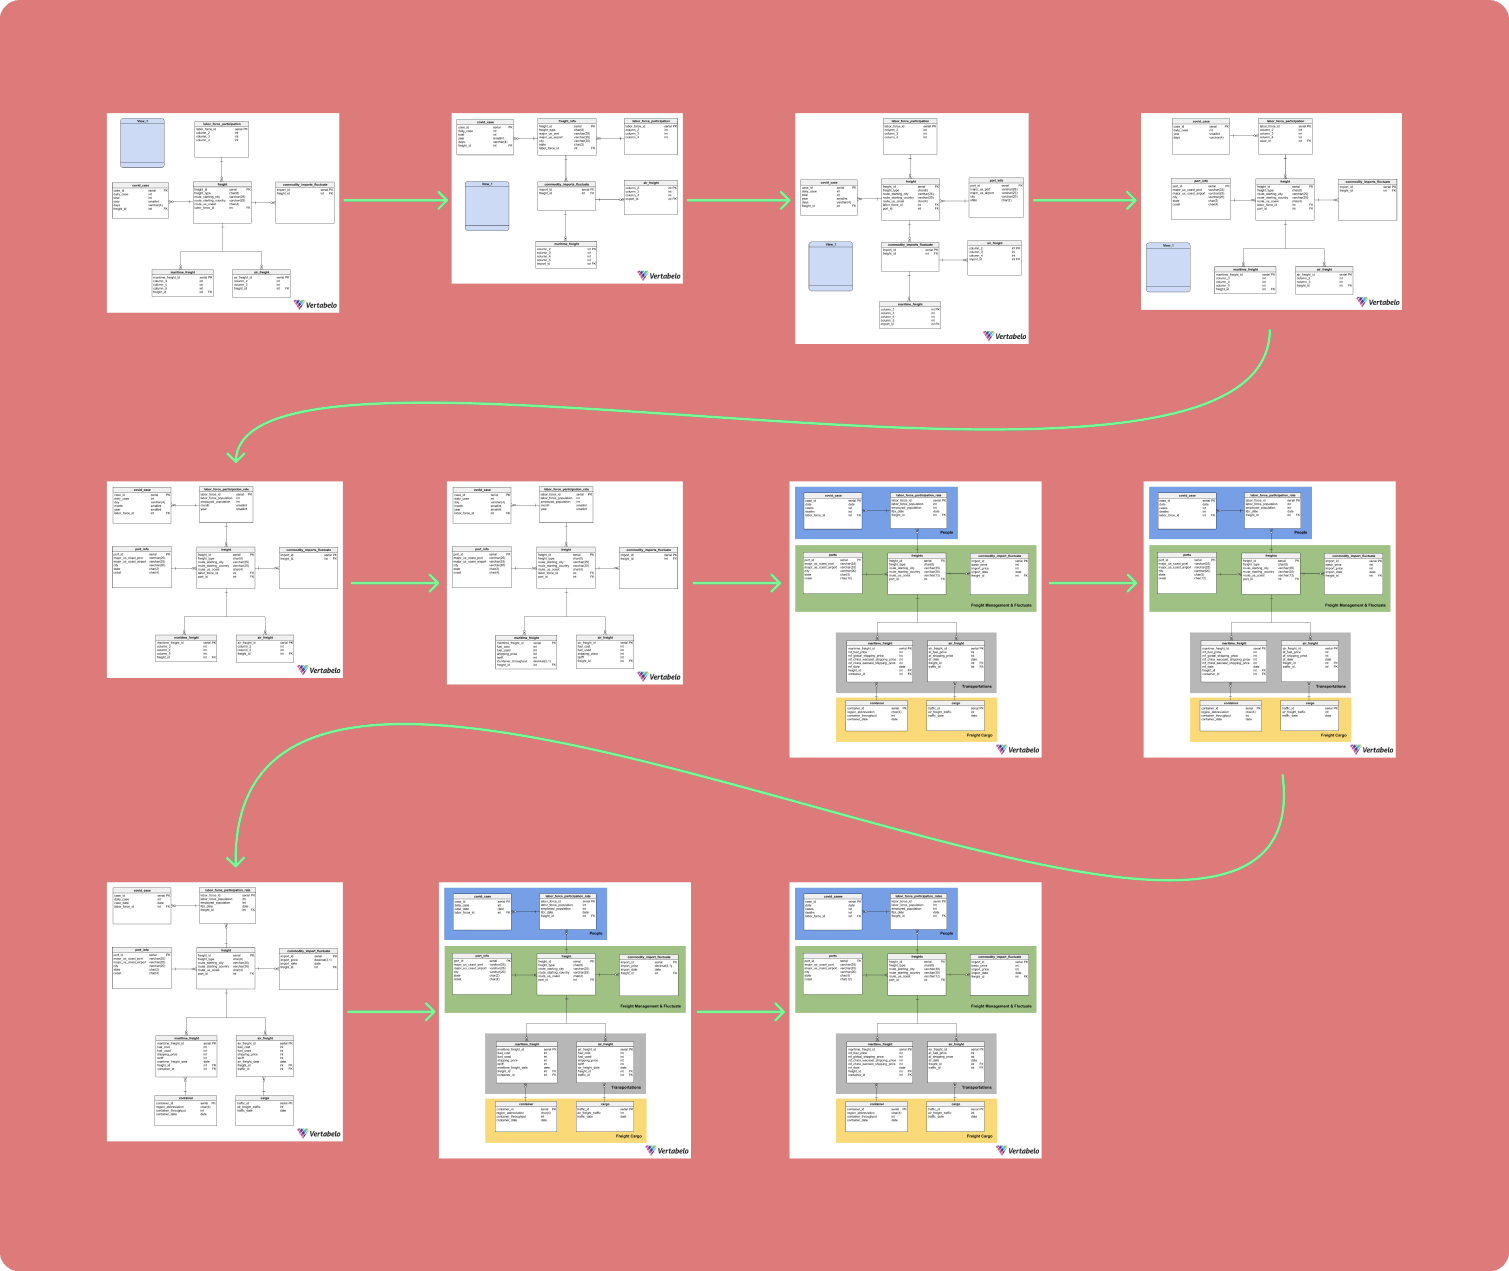
Entity Relationship Diagram Iteration
Current Entity Relationship Diagram
Segment Data
Change the presentation of data to different users based on common characteristics of specific interests or needs.
In order to integrate the collected data into a standardized database, I set the database development goals, three prototype development stages, and design principles, and confirmed the project deadline and detailed specifications with the instructor. Compared with database and website development resources, we devote fewer resources to user experience design. Therefore, we iterated through 11 versions of entity relationship diagrams to help the team identify users' main pain points and provide suggestions for potential improvement areas.
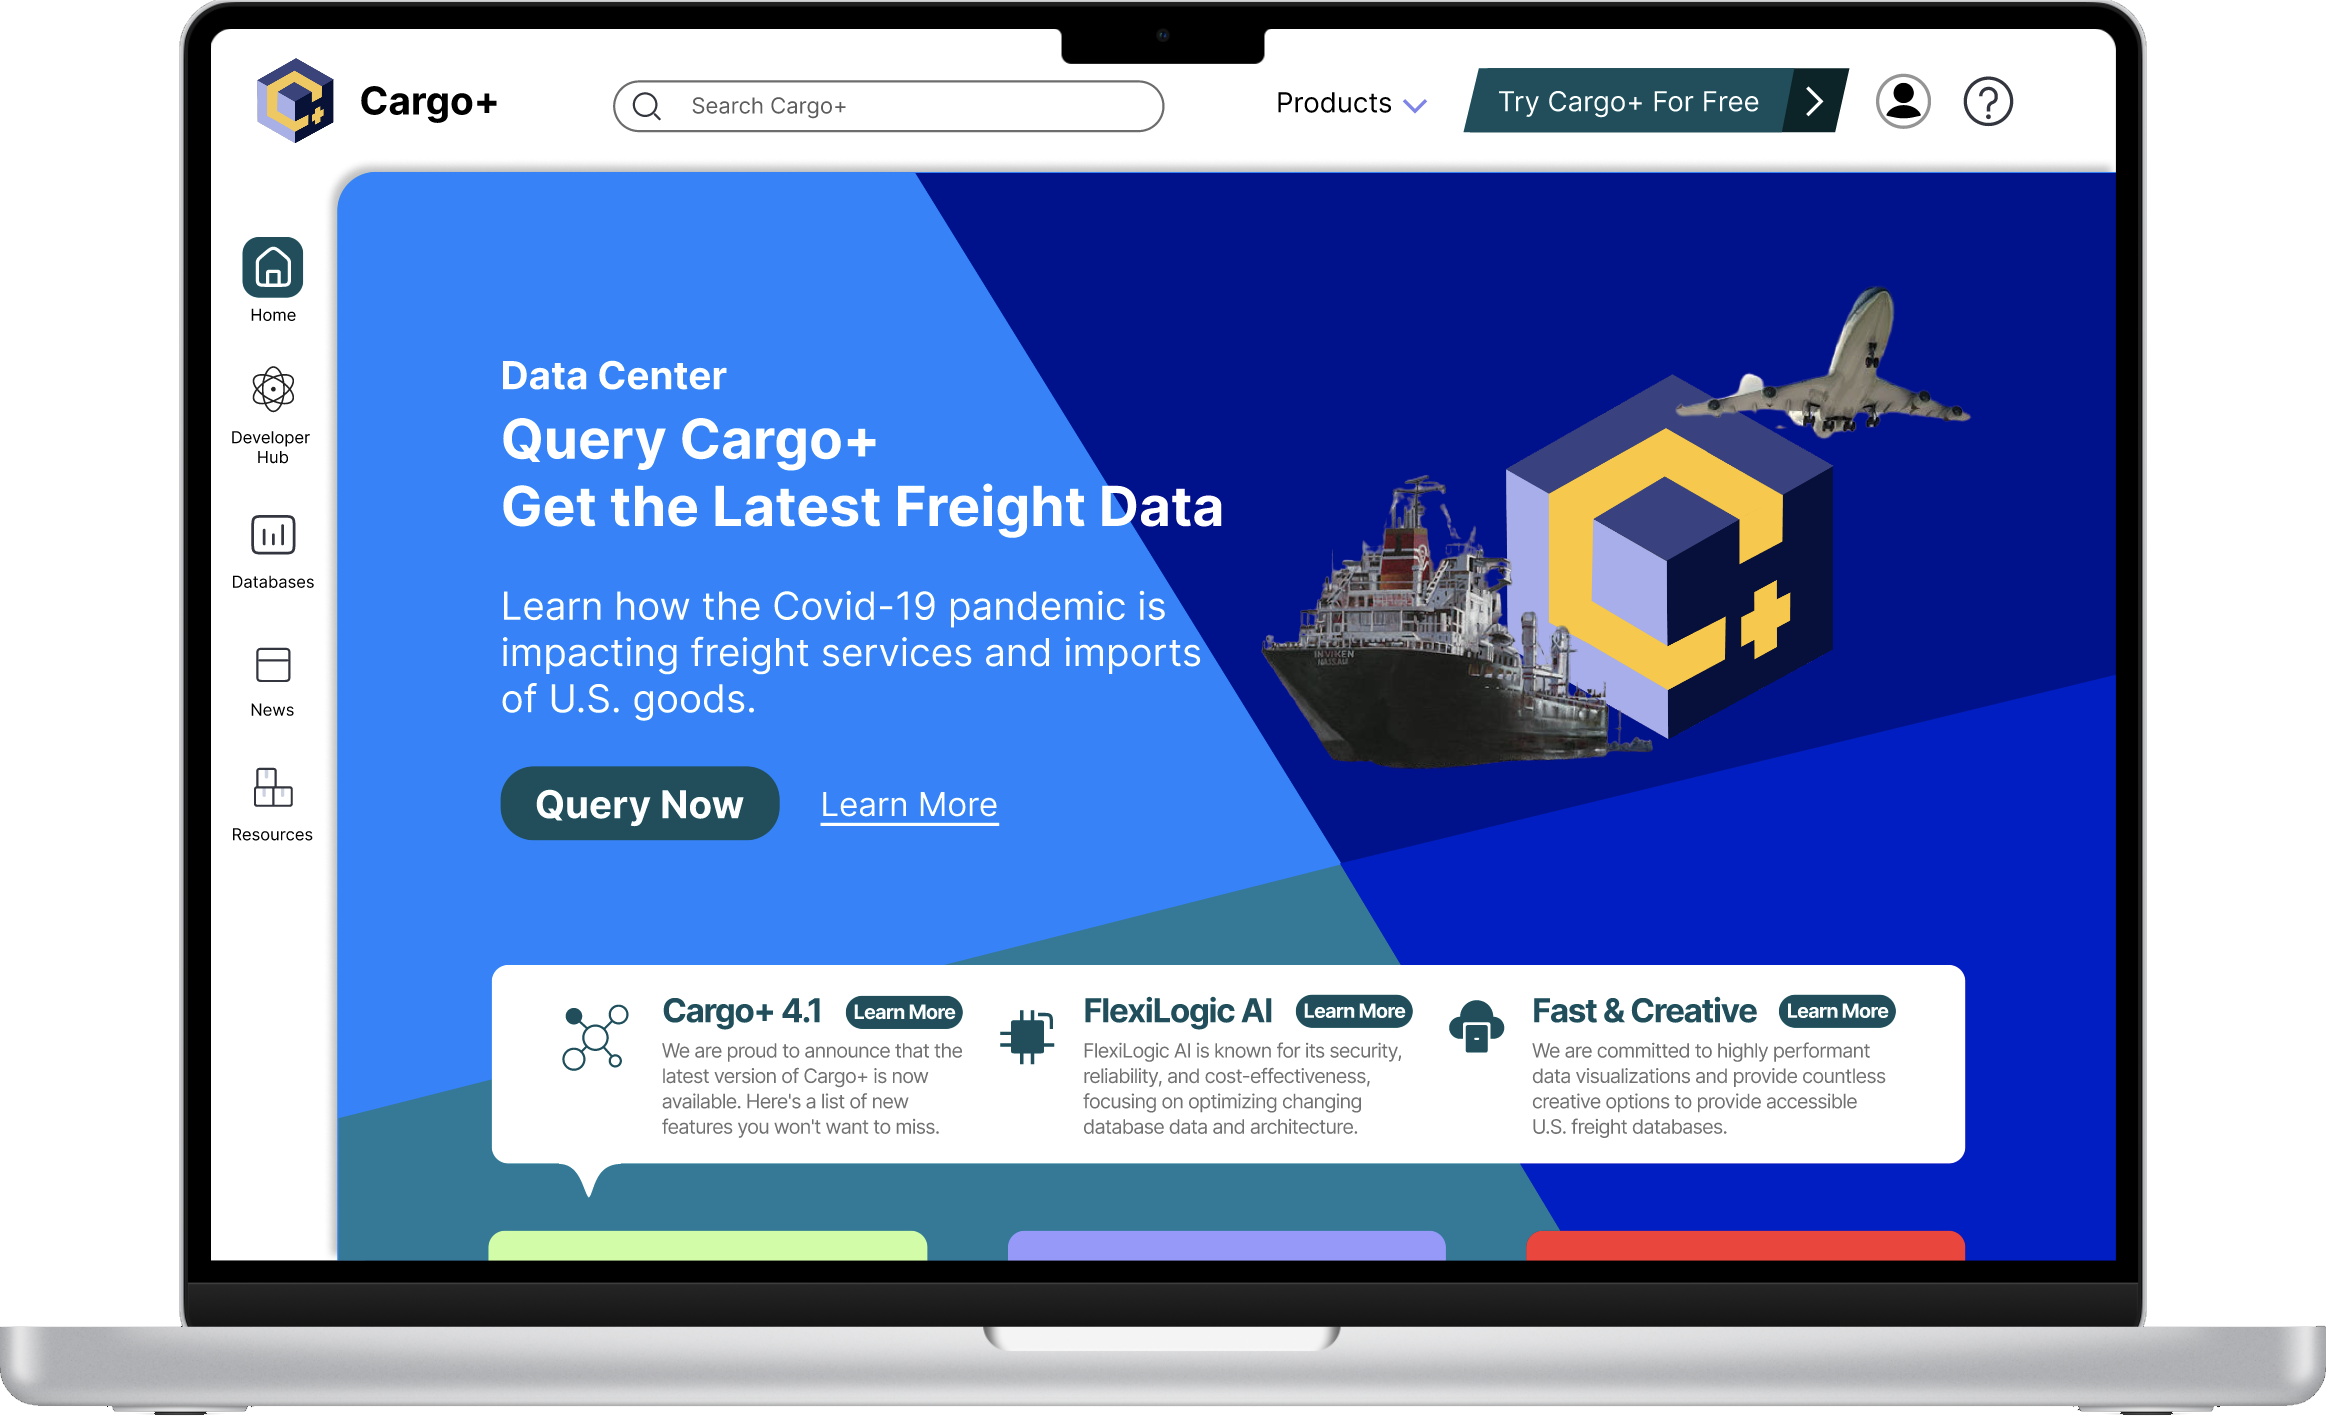
Cargo+ not only provides a U.S. freight data center, but also allows developers to build their own company's database.
Users can search and browse the latest data on the impact of COVID-19 on the U.S. transportation industry on Cargo+. Freight practitioners can also build their own company database on Cargo+, compare monthly national transportation industry statistics, and create their online workspace.
We focused on functionality and how to make the back-end database work smoothly with the front-end website.
Core functions are given independent capabilities and linked to other pages to form a circular experience for the user. Visual design was left last because we didn't want the UI to take over the focus of database management design.
Low Fidelity Prototype
Automatic Speech Recognition
Usability Testing
We asked 5 participants to perform 5 main tasks. The prototype consists of a back-end database and a front-end website. Participants will conduct quick queries on the site, set personalization options, enable automatic speech recognition, view custom and saved queries, and create their own workflows.
User Feedback and Validation
Solution
Switch between Database & Workspace
01
|
Cargo+
01
|
Avoid Overdesigning
Participants pointed out that the toolbar was arranged with too many function buttons and was difficult to understand and use without extra explanation.
We redesigned the toolbar and moved it to the settings page of the function menu on the left, and the function bar only retains the functions with the most positive feedback from users.
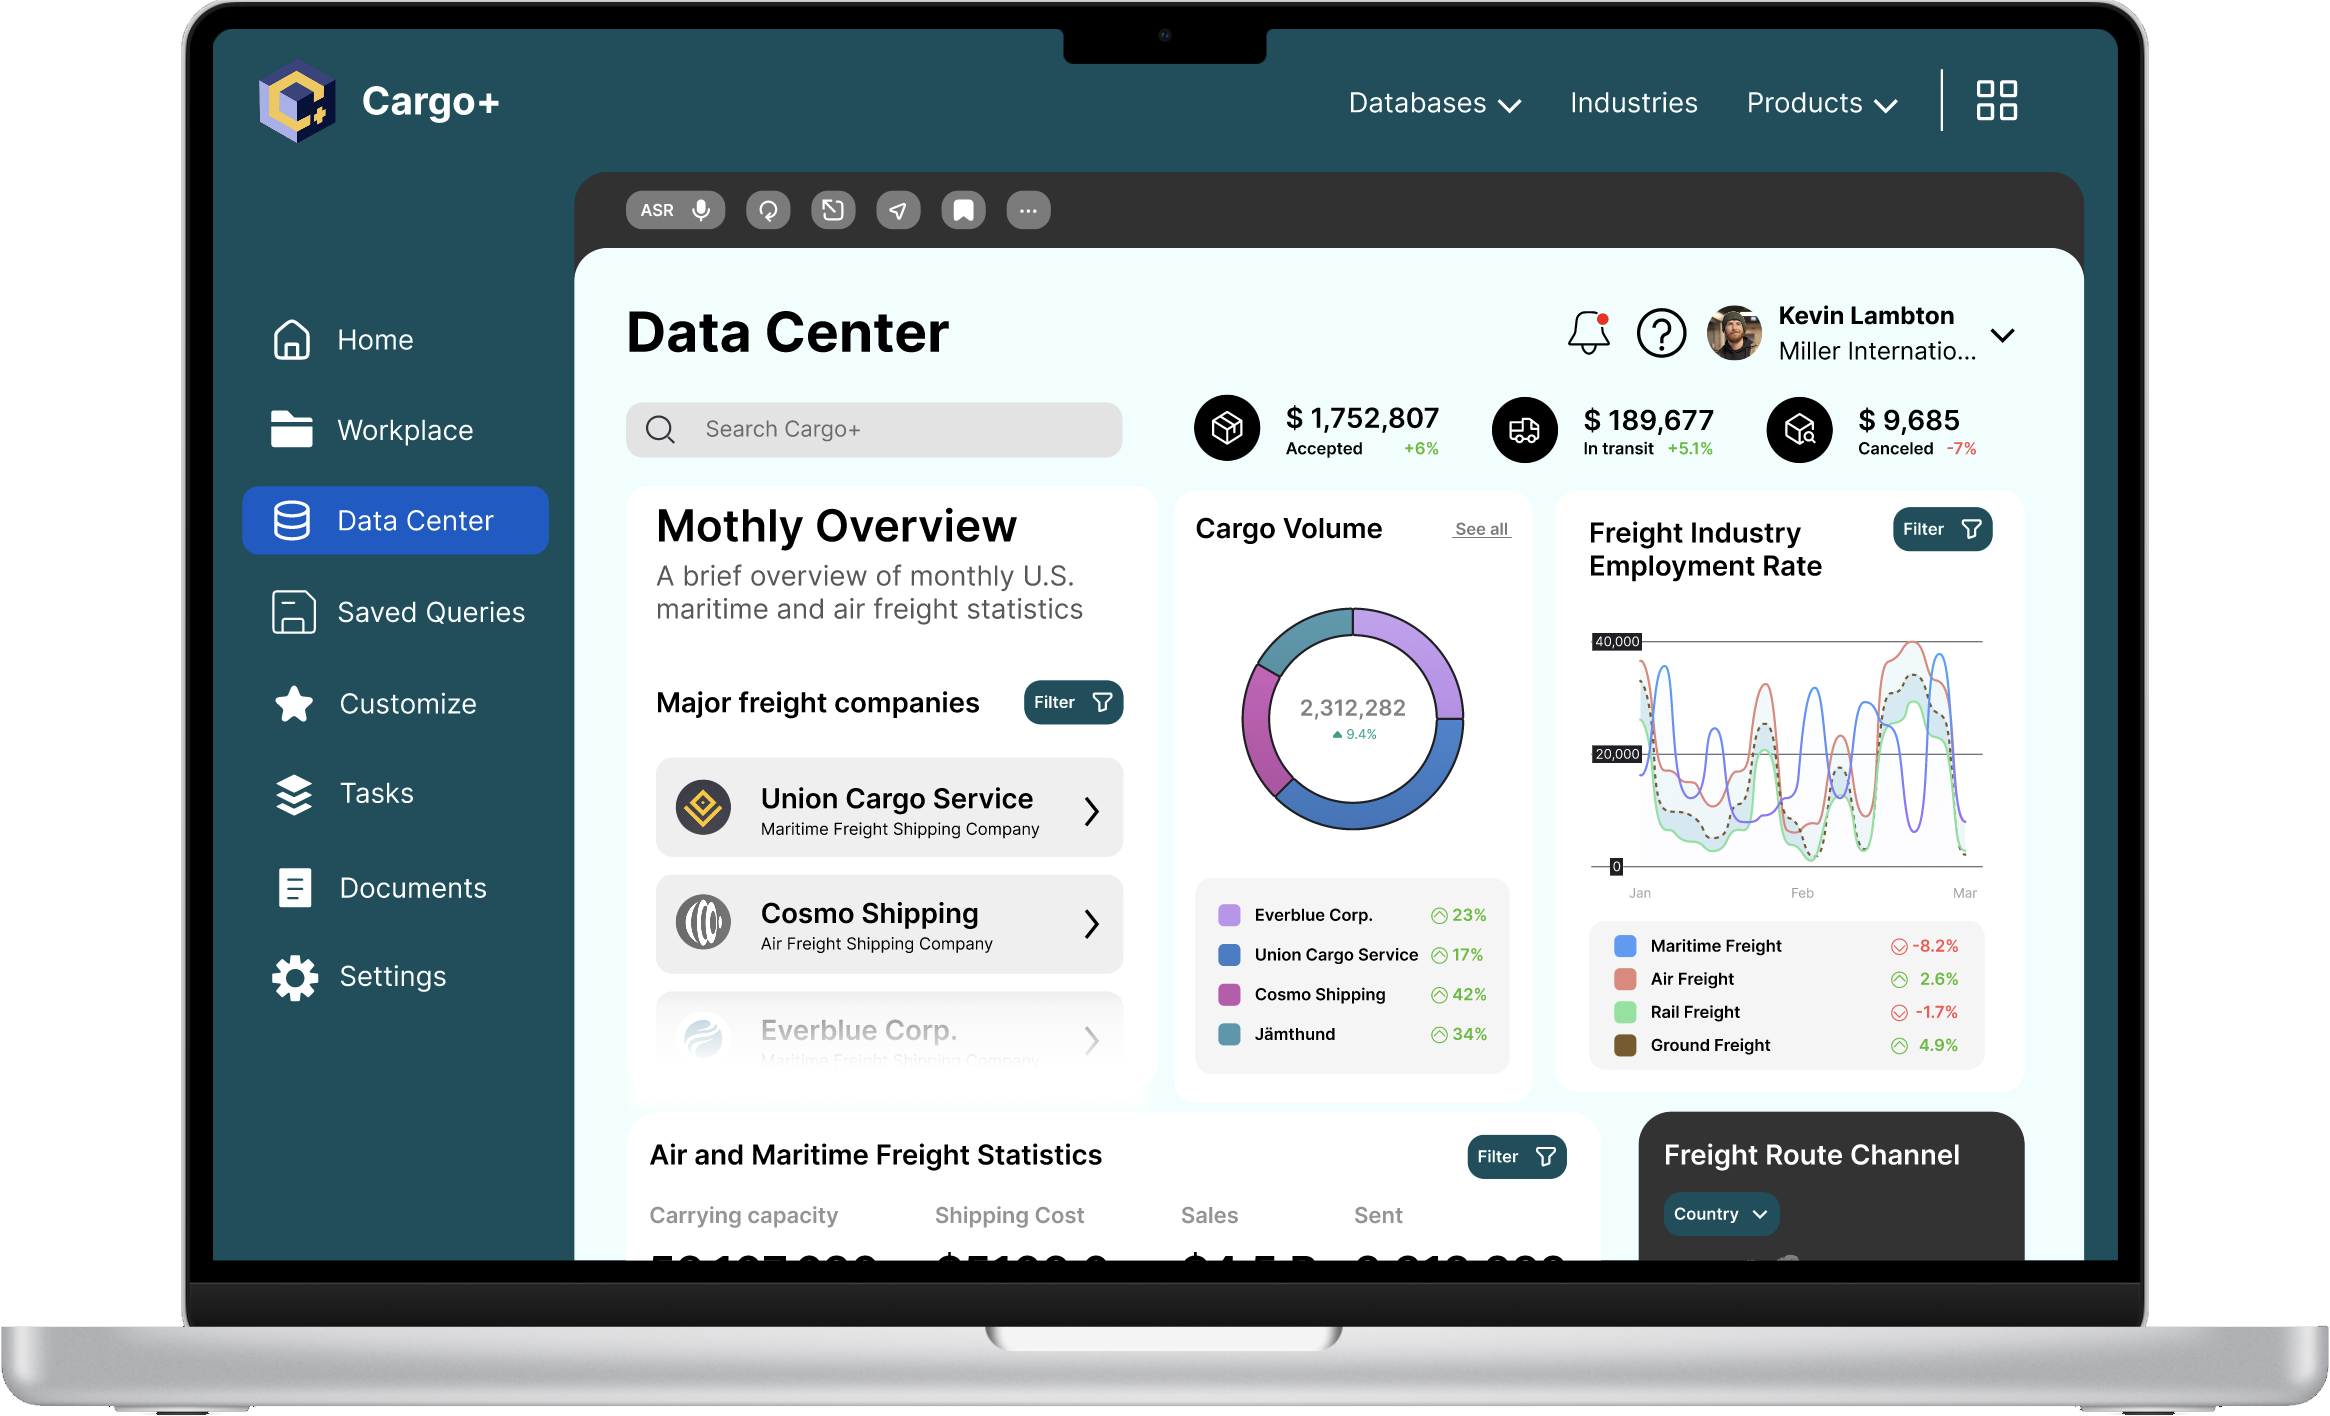
Data Center
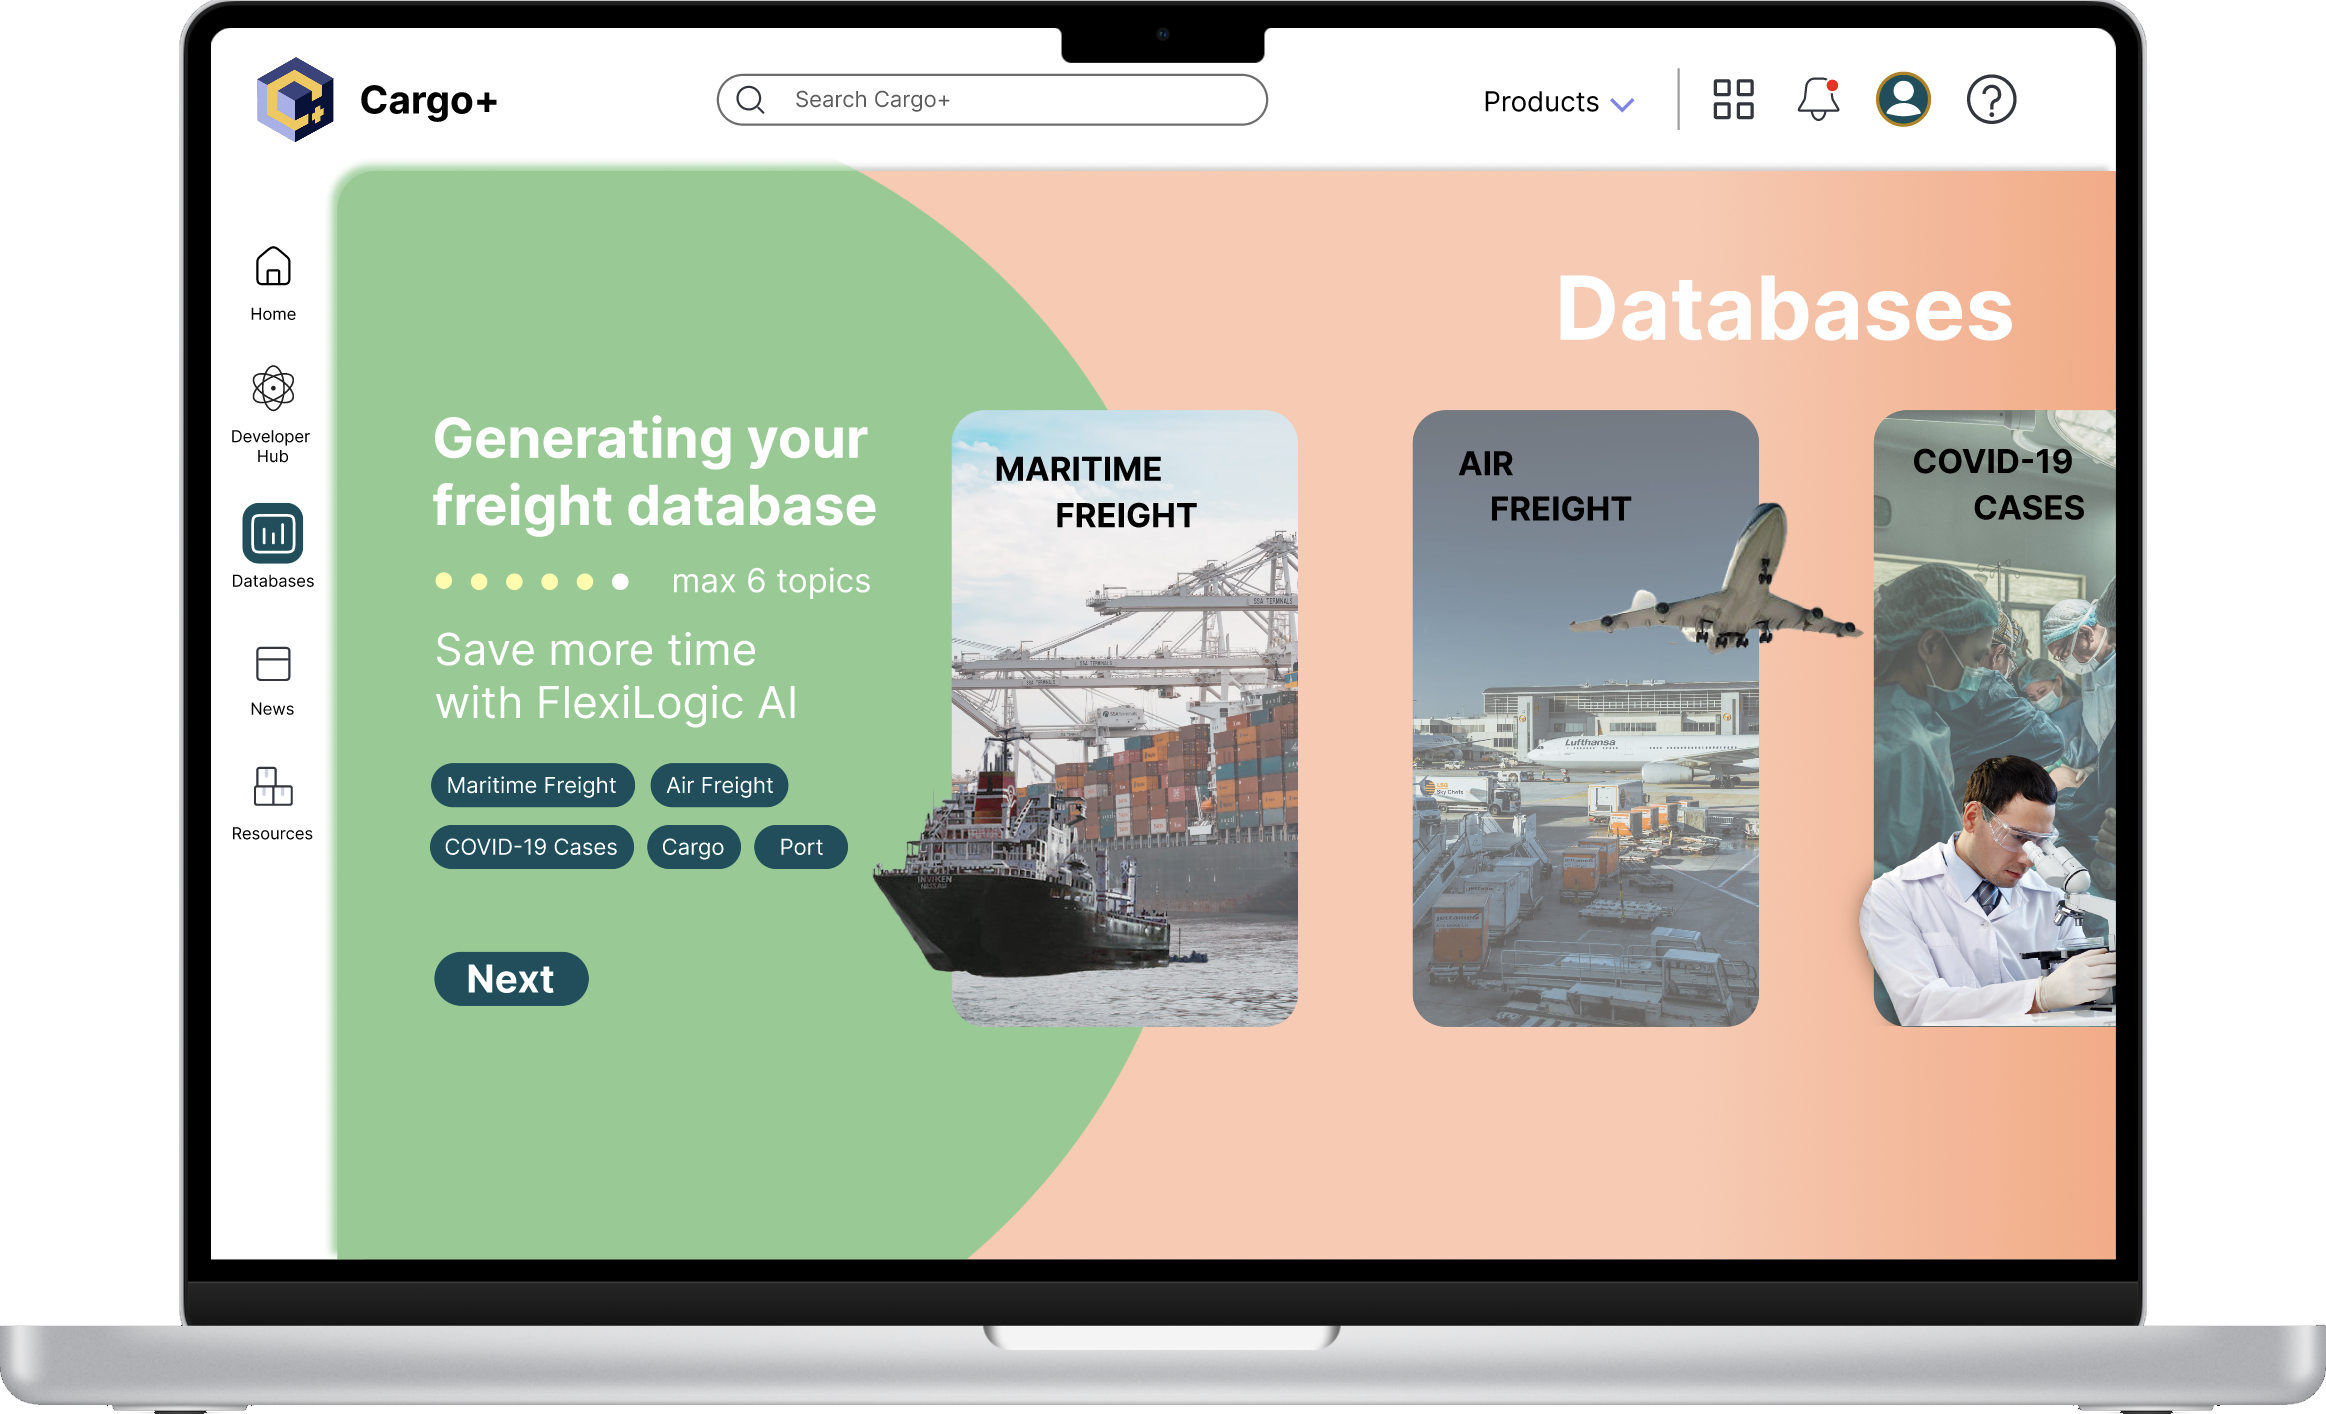
Immersive Experience
Cargo+ subverts the industry's imagination of databases and transforms data into animated visuals and art!
Users can choose a local or external database and select the theme of the database and table to let the system start visualizing the data and present the data to the user sequentially in an intuitive and aesthetic way.
Reflection
Expand Data Scope
I concluded this 10-month project by co-writing a design research paper with my team members and submitting it to the UW Tacoma School of Engineering & Technology. Through this project, I was able to expand my experience working and collaborating with cross-functional team members and learn more about what types of design decisions are in line with user and stakeholder needs, and which ones are inconsistent with business decisions.
Publication
Our team acknowledge that the COVID-19 epidemic will be over in 2 to 3 years, and Cargo+ will transform into a more comprehensive database and service website by then. In future planning, my team expects to develop Cargo+ into a comprehensive database and service-oriented website that studies the impact of U.S. freight in the global economy to serve more U.S. freight operators.
User Value
Since we focused on database management and design in the early stages of design, we did not realize that user value would have the most direct impact on product design. In usability testing, we learn that understanding users requires more than just conducting user interviews, but also a deeper understanding of their values and life priorities. In this way, we can truly design products that give users a better experience.
Simplified Database Structure
Because the information covered by the database is too trivial, participants stated that the structure of the database was too complex, which is unfriendly to users.
We combined data on the same topic in the database into a single table and removed irrelevant information, such as changes in fuel use by freighters. The biggest purpose of the modification is to keep the structure of the database simple but detailed.
02
|
Avoid Repetitive Actions
Some participants claimed that they needed to enter repeated SQL queries to obtain the data again and that this process was tedious and time-consuming.
In response to this problem, we have added a query history section to help users quickly access the data they have queried in the past to simplify their usage process and improve efficiency.
A database management tool helps transportation workers understand the impact of COVID-19 on U.S. freight and imports
03
|
For users who deal with multiple tasks or have poor vision, automatic speech recognition (ASR) is an indispensable auxiliary function for the database.
ASR allows users to make the database interactive voice assistant access the PostgreSQL database by issuing voice commands on the website interface. The voice command will first check the initialized command set, correspond to the SQL query, and finally output the data corresponding to the selected database or table.
The data center presents users with the latest U.S. freight industry data during the COVID-19 epidemic in a customized interface based on user’s choices.
Users can query data in the data center and visit the data they may need from the database's recommended list. In addition, users can also save the data they need to the Saved Query page.
|
References
Bureau of Transportation Statistics. “Air Cargo Summary Data (All),” Bureau of Transportation Statistics, updated 2024, www.transtats.bts.gov/freight.asp.
Bureau of Transportation Statistics. “Latest Supply Chain and Freight Indicators,” Bureau of Transportation Statistics, updated August 20, 2024, www.bts.gov/freight-indicators#container-capacity.
United States International Trade Commission. “The Impact of the COVID-19 Pandemic on Freight Transportation Services and U.S. Merchandise Imports,” United States International Trade Commission, 2022, www.usitc.gov/research_and_analysis/tradeshifts/2020/special_topic.html#_ftn7.
UNCTAD. “Review of Maritime Transport 2022,” UN trade & development, 2023, unctad.org/rmt2022.
Statista Research Department. “Air Freight Rate Changes since the Beginning of Coronavirus Outbreak 2019-2022.” Statista, March, 2022, www.statista.com/statistics/1106691/air-freight-rates-globally-coronavirus-impact/.
Statista Research Department. “Distribution Share of Freight Ton Kilometers (FTK) of Global International Scheduled Air Freight Regional Routes in 2020.” Statista, July, 2021, www.statista.com/statistics/1114034/air-freight-traffic-international-freight-tone-kilometers-route/.
Elflein, John. “Number of cumulative cases of COVID-19 in the United States from January 20, 2020 to November 11, 2022, by week.” Statista, Nov, 2022, www.statista.com/statistics/1103185/cumulative-coronavirus-covid19-cases-number-us-by-day/.
United States International Trade Commission. “U.S. Trade by Industry Sectors and Selected Trading Partners,” United States International Trade Commission, 2023, www.usitc.gov/research_and_analysis/tradeshifts/2022/us_trade_industry_sectors_and_selected_trading.


